import numpy as np
import matplotlib.pyplot as plt
import seaborn as sns
import pandas as pd
from sklearn.cluster import KMeans
from sklearn.metrics import confusion_matrixClustering and Discrete Latent Variables
Graduate Quantitative Economics and Datascience
k-means Clustering
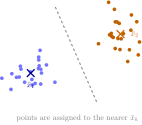
- Consider that the observations \(n \in S_k\) should have similar \(x_n\)
- Group observations that are close or similar to each other
- As always in linear algebra, close suggests using a norm. The Euclidean norm in the \(M\) dimensional feature space is a good baseline
- Objective function of k-means: choose the partition \(\mathbf{S}\) which minimizes the norm between observations within each group
- Normalize by group size \(|S_k|\) to avoid distorting the objective function due to different group sizes
Plotting Code with Seaborn
fig, ax = plt.subplots()
sns.scatterplot(data=df, x="f1", y="f2",
  hue="k", ax=ax)
ax.set(xlabel="Feature 1", ylabel="Feature 2",
  title="Latent Groups")
plt.show()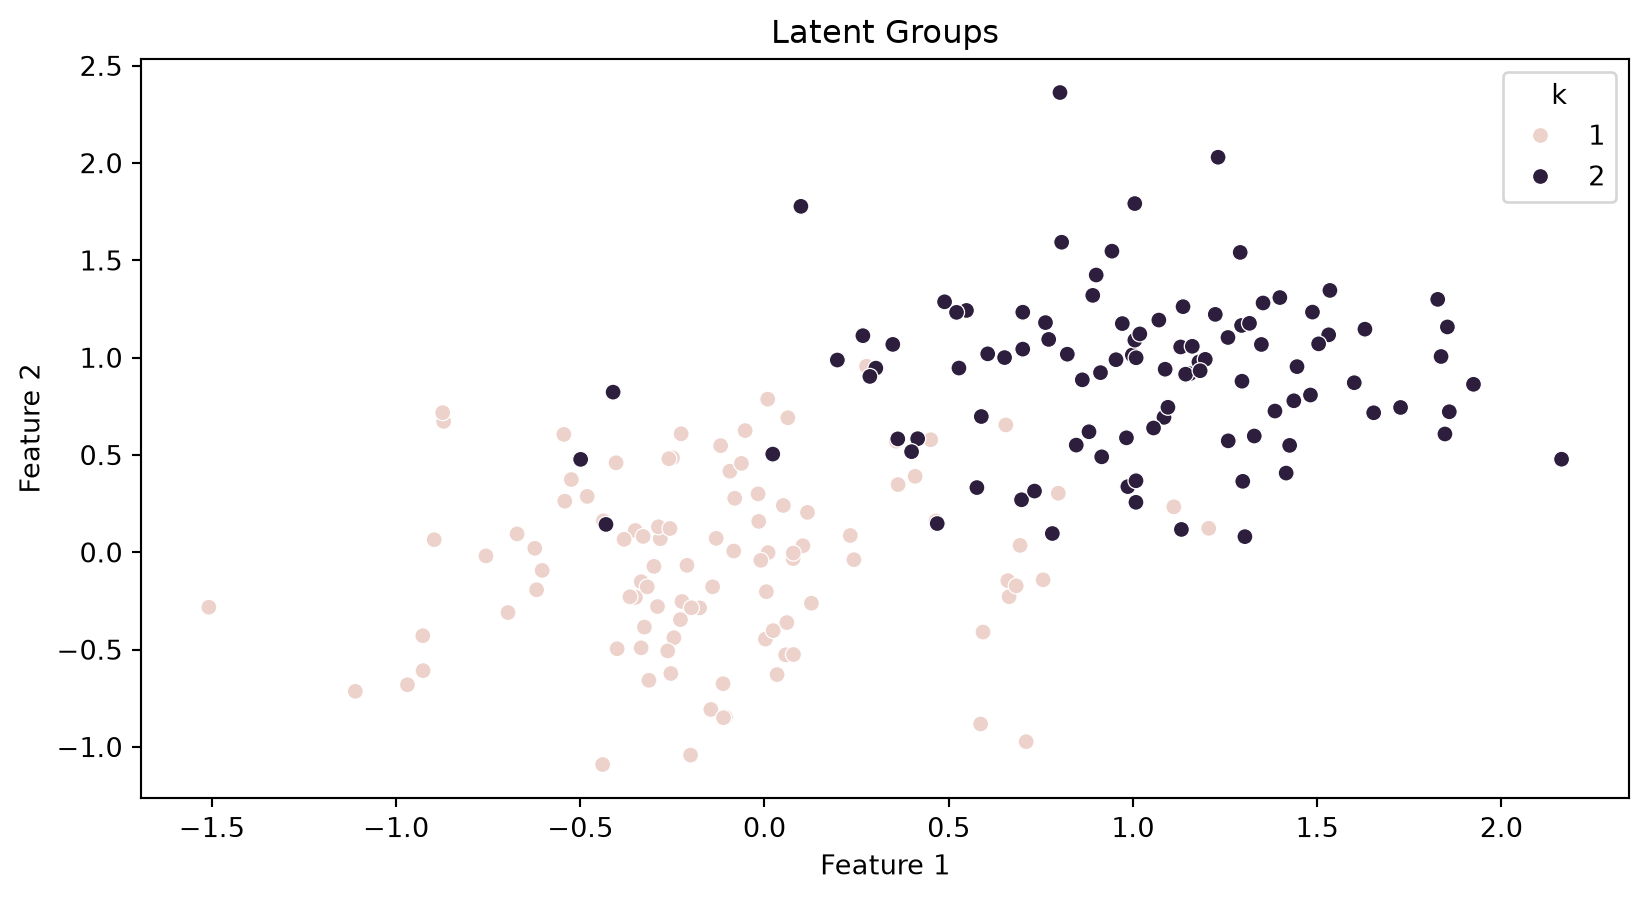
Confusion Matrix
- Cross-tabulate the latent \(k\) against the assigned \(\hat{k}\), as in the classification lecture, except that cluster labels are arbitrary
# compute confusion matrix
cm = confusion_matrix(df["k"], df["k_hat"])

# plot confusion matrix
sns.heatmap(cm, annot=True, fmt='d', cmap='Blues',
            xticklabels=[1, 2], yticklabels=[1, 2])
plt.xlabel('Predicted k')
plt.ylabel('True k')
plt.title('Confusion Matrix')
plt.show()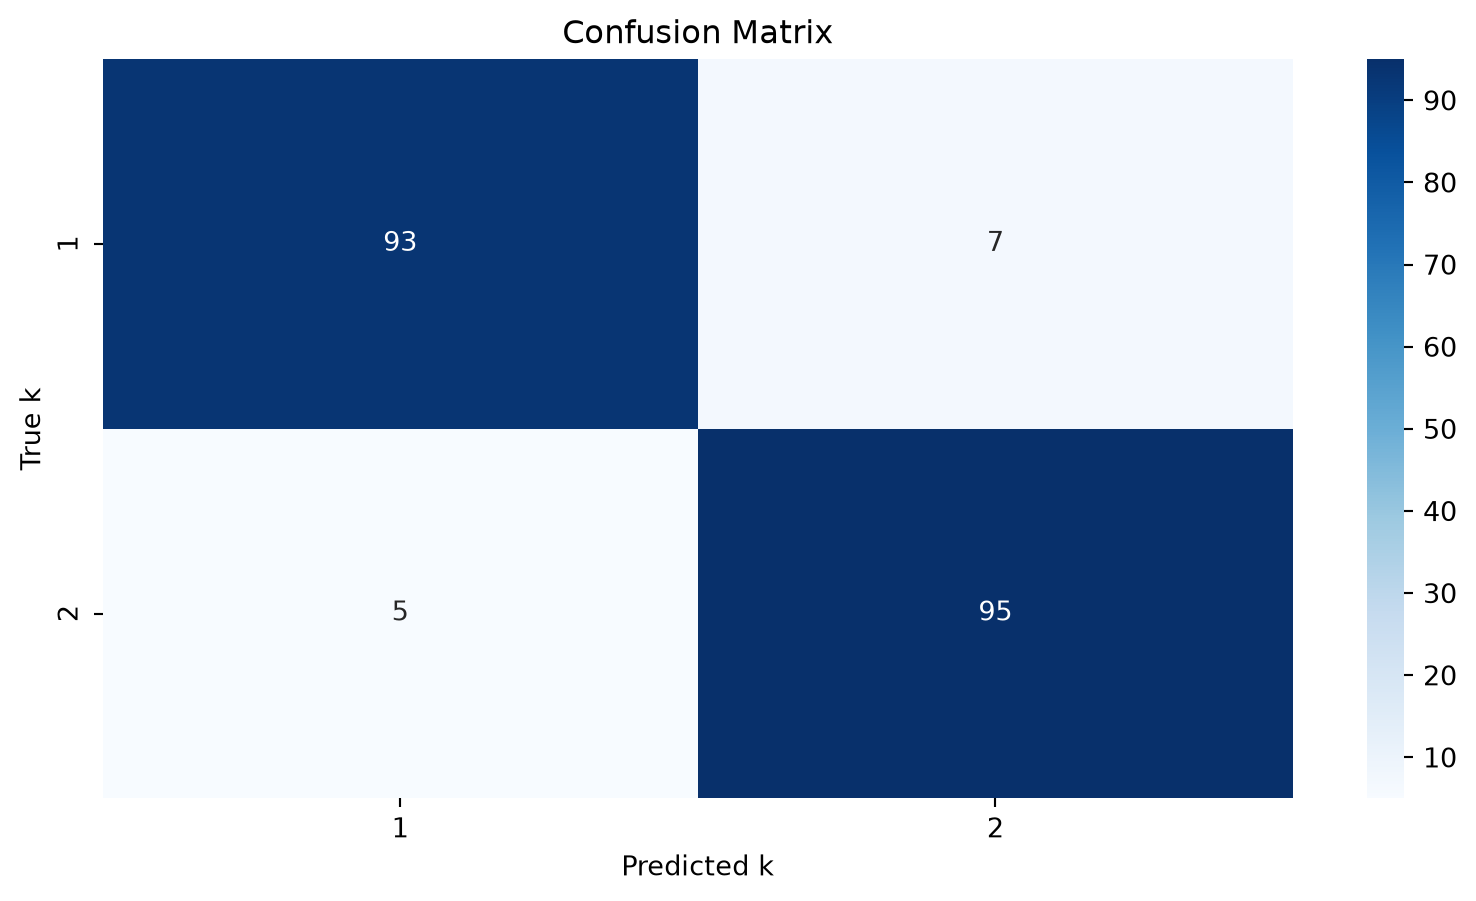
Plotting the Uncovered Latent Groups
fig, ax = plt.subplots(figsize=(6, 4))
sns.scatterplot(data=df, x="f1", y="f2",
  hue="Cluster", ax=ax)
ax.set(xlabel="Feature 1", ylabel="Feature 2",
       title="k-means Recovered Groups")
plt.show()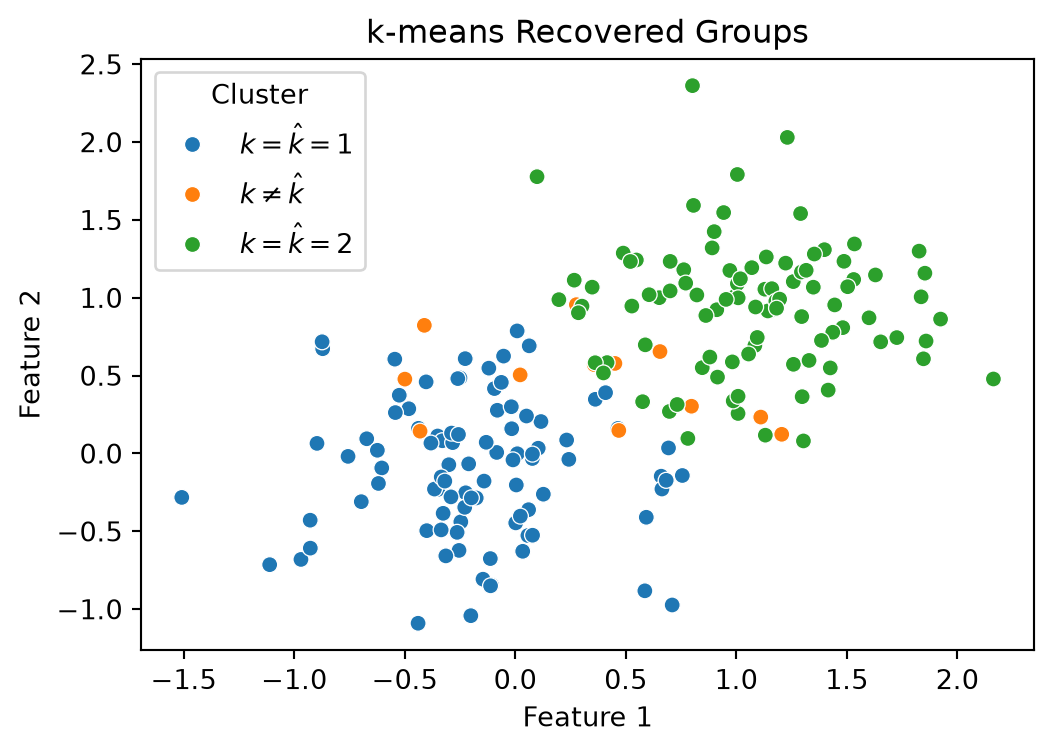
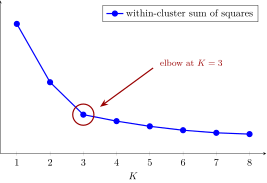
Example of Elbow
- Plot the within-cluster sum of squares as a function of \(K\)
- It falls to \(0\) at \(K = N\), but the kink suggests where the marginal improvement slows. See Wikipedia